|
Download Data (XLS File) |
|
||||||||
|
||||||||
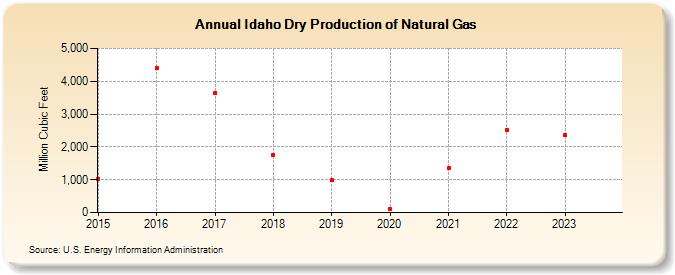
| Idaho Dry Production of Natural Gas (Million Cubic Feet) | ||||||||
| Decade | Year-0 | Year-1 | Year-2 | Year-3 | Year-4 | Year-5 | Year-6 | Year-7 | Year-8 | Year-9 |
|---|---|---|---|---|---|---|---|---|---|---|
| 2010's | 1,030 | 4,400 | 3,645 | 1,746 | 986 | |||||
| 2020's | 107 | 1,355 | 2,528 | 2,359 | 1,124 |
| - = No Data Reported; -- = Not Applicable; NA = Not Available; W = Withheld to avoid disclosure of individual company data. |
| Release Date: 6/30/2026 |
| Next Release Date: 7/31/2026 |