|
Download Data (XLS File) |
|
|||||
|
|||||
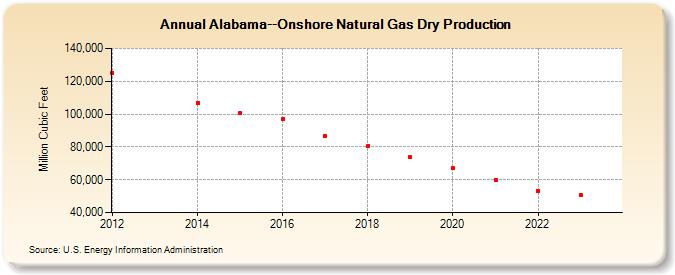
| Alabama--Onshore Natural Gas Dry Production (Million Cubic Feet) | |||||
| Decade | Year-0 | Year-1 | Year-2 | Year-3 | Year-4 | Year-5 | Year-6 | Year-7 | Year-8 | Year-9 |
|---|---|---|---|---|---|---|---|---|---|---|
| 2010's | 125,180 | 106,903 | 100,663 | 96,957 | 86,700 | 80,287 | 73,676 | |||
| 2020's | 66,934 | 59,878 | 53,240 | 50,208 | 44,130 |
| - = No Data Reported; -- = Not Applicable; NA = Not Available; W = Withheld to avoid disclosure of individual company data. |
| Release Date: 6/30/2026 |
| Next Release Date: 7/31/2026 |