|
Download Data (XLS File) |
|
||||||||
|
||||||||
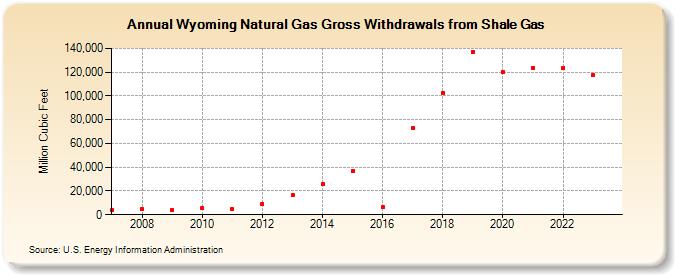
| Wyoming Natural Gas Gross Withdrawals from Shale Gas (Million Cubic Feet) | ||||||||
| Decade | Year-0 | Year-1 | Year-2 | Year-3 | Year-4 | Year-5 | Year-6 | Year-7 | Year-8 | Year-9 |
|---|---|---|---|---|---|---|---|---|---|---|
| 2000's | 3,897 | 4,776 | 4,055 | |||||||
| 2010's | 5,519 | 4,755 | 9,252 | 16,175 | 25,783 | 36,790 | 6,193 | 72,911 | 102,846 | 137,073 |
| 2020's | 119,934 | 123,538 | 123,516 | 117,786 | 112,120 |
| - = No Data Reported; -- = Not Applicable; NA = Not Available; W = Withheld to avoid disclosure of individual company data. |
| Release Date: 6/30/2026 |
| Next Release Date: 7/31/2026 |