|
Download Data (XLS File) |
|
||||||||
|
||||||||
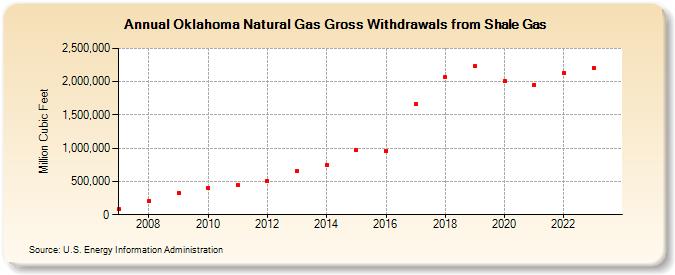
| Oklahoma Natural Gas Gross Withdrawals from Shale Gas (Million Cubic Feet) | ||||||||
| Decade | Year-0 | Year-1 | Year-2 | Year-3 | Year-4 | Year-5 | Year-6 | Year-7 | Year-8 | Year-9 |
|---|---|---|---|---|---|---|---|---|---|---|
| 2000's | 83,015 | 204,474 | 327,805 | |||||||
| 2010's | 406,143 | 449,167 | 503,329 | 663,507 | 746,686 | 972,498 | 965,034 | 1,659,336 | 2,063,870 | 2,229,805 |
| 2020's | 2,012,050 | 1,957,111 | 2,135,287 | 2,097,510 | 2,047,980 |
| - = No Data Reported; -- = Not Applicable; NA = Not Available; W = Withheld to avoid disclosure of individual company data. |
| Release Date: 6/30/2026 |
| Next Release Date: 7/31/2026 |