|
Download Data (XLS File) |
|
||||||||
|
||||||||
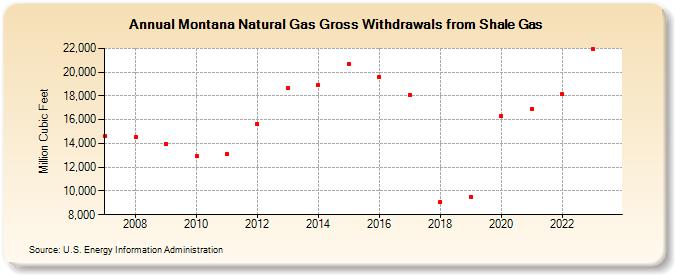
| Montana Natural Gas Gross Withdrawals from Shale Gas (Million Cubic Feet) | ||||||||
| Decade | Year-0 | Year-1 | Year-2 | Year-3 | Year-4 | Year-5 | Year-6 | Year-7 | Year-8 | Year-9 |
|---|---|---|---|---|---|---|---|---|---|---|
| 2000's | 14,587 | 14,509 | 13,957 | |||||||
| 2010's | 12,937 | 13,101 | 15,619 | 18,636 | 18,910 | 20,704 | 19,633 | 18,092 | 9,111 | 9,494 |
| 2020's | 16,302 | 16,924 | 18,166 | 22,200 | 26,046 |
| - = No Data Reported; -- = Not Applicable; NA = Not Available; W = Withheld to avoid disclosure of individual company data. |
| Release Date: 6/30/2026 |
| Next Release Date: 7/31/2026 |