|
Download Data (XLS File) |
|
||||||||
|
||||||||
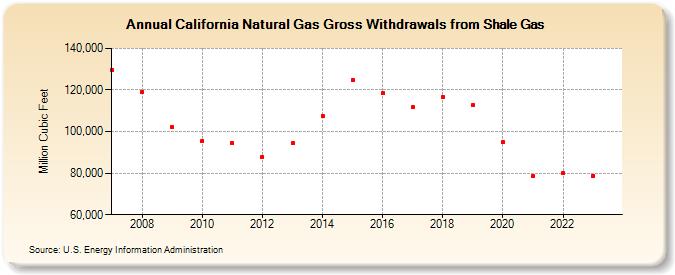
| California Natural Gas Gross Withdrawals from Shale Gas (Million Cubic Feet) | ||||||||
| Decade | Year-0 | Year-1 | Year-2 | Year-3 | Year-4 | Year-5 | Year-6 | Year-7 | Year-8 | Year-9 |
|---|---|---|---|---|---|---|---|---|---|---|
| 2000's | 129,488 | 119,215 | 102,027 | |||||||
| 2010's | 95,505 | 94,349 | 87,854 | 94,268 | 107,577 | 124,822 | 118,498 | 111,662 | 116,671 | 112,721 |
| 2020's | 94,892 | 78,505 | 79,893 | 79,452 | 75,150 |
| - = No Data Reported; -- = Not Applicable; NA = Not Available; W = Withheld to avoid disclosure of individual company data. |
| Release Date: 6/30/2026 |
| Next Release Date: 7/31/2026 |