|
Download Data (XLS File) |
|
||||||||
|
||||||||
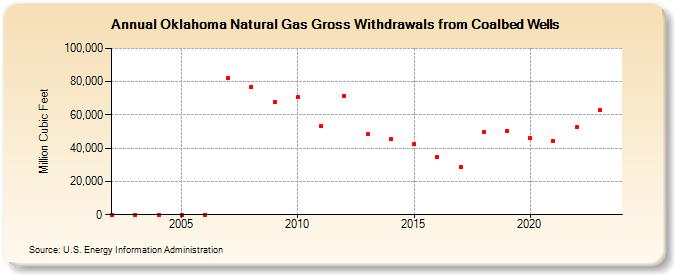
| Oklahoma Natural Gas Gross Withdrawals from Coalbed Wells (Million Cubic Feet) | ||||||||
| Decade | Year-0 | Year-1 | Year-2 | Year-3 | Year-4 | Year-5 | Year-6 | Year-7 | Year-8 | Year-9 |
|---|---|---|---|---|---|---|---|---|---|---|
| 2000's | 0 | 0 | 0 | 0 | 0 | 82,125 | 76,860 | 67,525 | ||
| 2010's | 70,581 | 53,206 | 71,553 | 48,417 | 45,751 | 42,713 | 34,801 | 28,987 | 49,481 | 50,409 |
| 2020's | 46,156 | 44,251 | 52,570 | 59,826 | 83,836 |
| - = No Data Reported; -- = Not Applicable; NA = Not Available; W = Withheld to avoid disclosure of individual company data. |
| Release Date: 6/30/2026 |
| Next Release Date: 7/31/2026 |