|
Download Data (XLS File) |
|
||||||||
|
||||||||
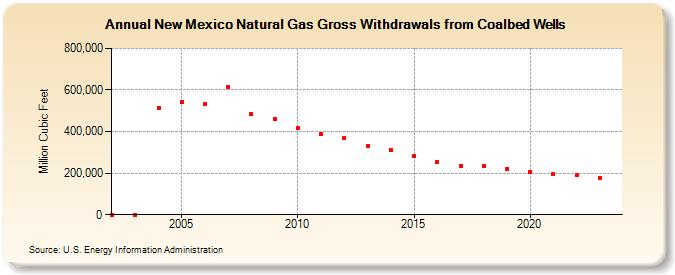
| New Mexico Natural Gas Gross Withdrawals from Coalbed Wells (Million Cubic Feet) | ||||||||
| Decade | Year-0 | Year-1 | Year-2 | Year-3 | Year-4 | Year-5 | Year-6 | Year-7 | Year-8 | Year-9 |
|---|---|---|---|---|---|---|---|---|---|---|
| 2000's | 0 | 0 | 514,913 | 541,408 | 534,760 | 616,485 | 485,682 | 458,805 | ||
| 2010's | 414,894 | 386,262 | 368,682 | 330,658 | 311,414 | 281,535 | 254,085 | 235,324 | 235,102 | 220,605 |
| 2020's | 204,498 | 193,583 | 189,242 | 178,733 | 168,080 |
| - = No Data Reported; -- = Not Applicable; NA = Not Available; W = Withheld to avoid disclosure of individual company data. |
| Release Date: 6/30/2026 |
| Next Release Date: 7/31/2026 |