|
Download Data (XLS File) |
|
||||||||
|
||||||||
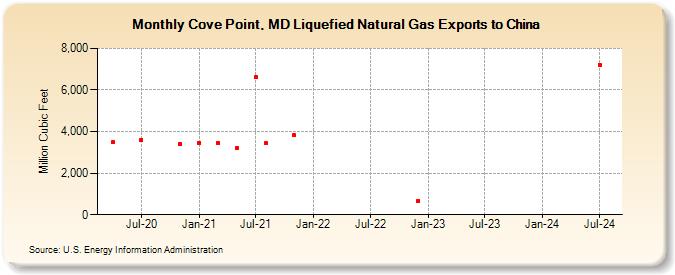
| Cove Point, MD Liquefied Natural Gas Exports to China (Million Cubic Feet) | ||||||||
| Year | Jan | Feb | Mar | Apr | May | Jun | Jul | Aug | Sep | Oct | Nov | Dec |
|---|---|---|---|---|---|---|---|---|---|---|---|---|
| 2020 | 3,475 | 3,607 | 3,402 | |||||||||
| 2021 | 3,463 | 3,451 | 3,218 | 6,624 | 3,429 | 3,822 | ||||||
| 2022 | 681 | |||||||||||
| 2024 | 7,222 | |||||||||||
| - = No Data Reported; -- = Not Applicable; NA = Not Available; W = Withheld to avoid disclosure of individual company data. |
| Release Date: 3/31/2026 |
| Next Release Date: 4/30/2026 |