|
Download Data (XLS File) |
|
|||||
|
|||||
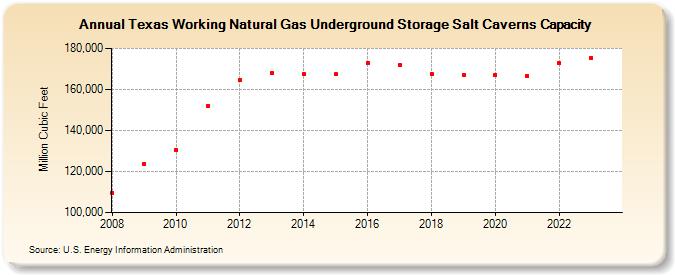
| Texas Working Natural Gas Underground Storage Salt Caverns Capacity (Million Cubic Feet) | |||||
| Decade | Year-0 | Year-1 | Year-2 | Year-3 | Year-4 | Year-5 | Year-6 | Year-7 | Year-8 | Year-9 |
|---|---|---|---|---|---|---|---|---|---|---|
| 2000's | 109,655 | 123,664 | ||||||||
| 2010's | 130,621 | 152,102 | 164,439 | 168,143 | 167,546 | 167,397 | 172,799 | 171,961 | 167,702 | 167,036 |
| 2020's | 167,064 | 166,497 | 172,847 | 175,525 | 174,746 |
| - = No Data Reported; -- = Not Applicable; NA = Not Available; W = Withheld to avoid disclosure of individual company data. |
| Release Date: 6/30/2026 |
| Next Release Date: 7/31/2026 |