|
Download Data (XLS File) |
|
|||||
|
|||||
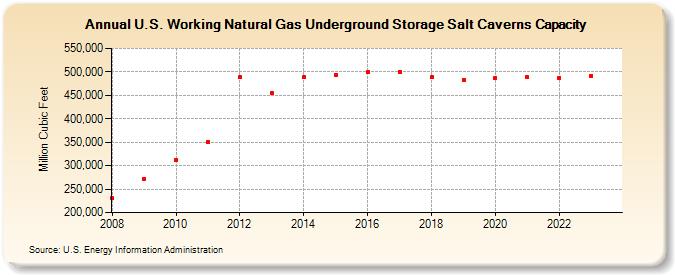
| U.S. Working Natural Gas Underground Storage Salt Caverns Capacity (Million Cubic Feet) | |||||
| Decade | Year-0 | Year-1 | Year-2 | Year-3 | Year-4 | Year-5 | Year-6 | Year-7 | Year-8 | Year-9 |
|---|---|---|---|---|---|---|---|---|---|---|
| 2000's | 230,456 | 271,785 | ||||||||
| 2010's | 312,003 | 351,017 | 488,268 | 455,729 | 488,698 | 493,976 | 499,233 | 500,596 | 488,557 | 483,165 |
| 2020's | 487,250 | 488,456 | 487,168 | 491,160 | 477,650 |
| - = No Data Reported; -- = Not Applicable; NA = Not Available; W = Withheld to avoid disclosure of individual company data. |
| Release Date: 6/30/2026 |
| Next Release Date: 7/31/2026 |