|
Download Data (XLS File) |
|
|||||
|
|||||
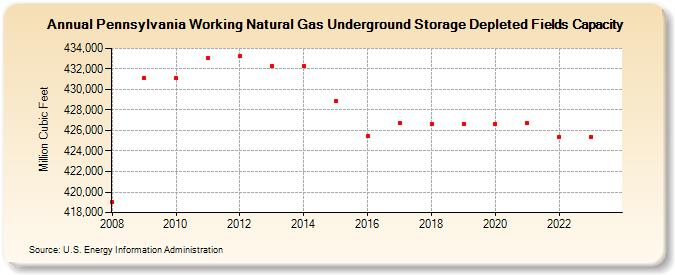
| Pennsylvania Working Natural Gas Underground Storage Depleted Fields Capacity (Million Cubic Feet) | |||||
| Decade | Year-0 | Year-1 | Year-2 | Year-3 | Year-4 | Year-5 | Year-6 | Year-7 | Year-8 | Year-9 |
|---|---|---|---|---|---|---|---|---|---|---|
| 2000's | 419,017 | 431,137 | ||||||||
| 2010's | 431,086 | 433,110 | 433,236 | 432,276 | 432,276 | 428,858 | 425,423 | 426,723 | 426,663 | 426,663 |
| 2020's | 426,663 | 426,688 | 425,388 | 425,388 | 425,388 |
| - = No Data Reported; -- = Not Applicable; NA = Not Available; W = Withheld to avoid disclosure of individual company data. |
| Release Date: 6/30/2026 |
| Next Release Date: 7/31/2026 |