|
Download Data (XLS File) |
|
|||||
|
|||||
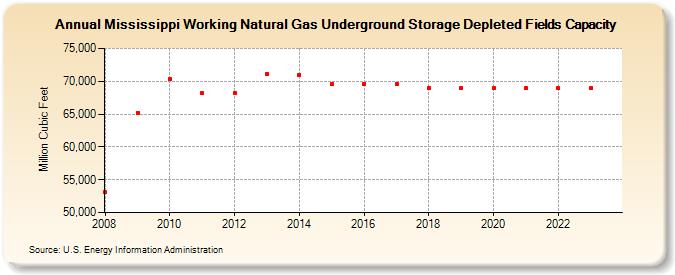
| Mississippi Working Natural Gas Underground Storage Depleted Fields Capacity (Million Cubic Feet) | |||||
| Decade | Year-0 | Year-1 | Year-2 | Year-3 | Year-4 | Year-5 | Year-6 | Year-7 | Year-8 | Year-9 |
|---|---|---|---|---|---|---|---|---|---|---|
| 2000's | 53,140 | 65,220 | ||||||||
| 2010's | 70,320 | 68,159 | 68,159 | 71,159 | 70,917 | 69,517 | 69,611 | 69,611 | 68,911 | 68,911 |
| 2020's | 68,911 | 68,911 | 68,911 | 68,911 | 68,911 |
| - = No Data Reported; -- = Not Applicable; NA = Not Available; W = Withheld to avoid disclosure of individual company data. |
| Release Date: 6/30/2026 |
| Next Release Date: 7/31/2026 |