|
Download Data (XLS File) |
|
||||||||
|
||||||||
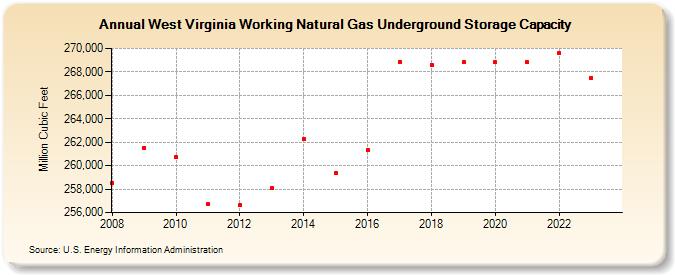
| West Virginia Working Natural Gas Underground Storage Capacity (Million Cubic Feet) | ||||||||
| Decade | Year-0 | Year-1 | Year-2 | Year-3 | Year-4 | Year-5 | Year-6 | Year-7 | Year-8 | Year-9 |
|---|---|---|---|---|---|---|---|---|---|---|
| 2000's | 258,563 | 261,546 | ||||||||
| 2010's | 260,744 | 256,692 | 256,643 | 258,056 | 262,305 | 259,381 | 261,345 | 268,869 | 268,626 | 268,803 |
| 2020's | 268,803 | 268,803 | 269,603 | 267,508 | 265,406 |
| - = No Data Reported; -- = Not Applicable; NA = Not Available; W = Withheld to avoid disclosure of individual company data. |
| Release Date: 6/30/2026 |
| Next Release Date: 7/31/2026 |