|
Download Data (XLS File) |
|
||||||||
|
||||||||
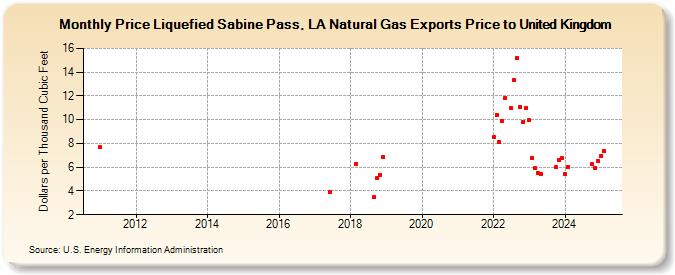
| Price Liquefied Sabine Pass, LA Natural Gas Exports Price to United Kingdom (Dollars per Thousand Cubic Feet) | ||||||||
| Year | Jan | Feb | Mar | Apr | May | Jun | Jul | Aug | Sep | Oct | Nov | Dec |
|---|---|---|---|---|---|---|---|---|---|---|---|---|
| 2011 | 7.66 | |||||||||||
| 2017 | 3.87 | |||||||||||
| 2018 | 6.28 | 3.46 | 5.13 | 5.38 | 6.87 | |||||||
| 2019 | W | W | W | W | W | W | W | |||||
| 2020 | W | W | W | W | W | W | W | |||||
| 2021 | W | W | W | W | W | W | ||||||
| 2022 | 8.51 | 10.40 | 8.09 | 9.90 | 11.83 | 10.98 | 13.31 | 15.15 | 11.06 | 9.83 | 10.99 | |
| 2023 | 9.94 | 6.80 | 5.92 | 5.47 | 5.44 | 8.07 | 5.99 | 6.59 | 6.80 | |||
| 2024 | 5.40 | 6.05 | 5.13 | 5.09 | 5.64 | 7.05 | 6.24 | 5.96 | 6.56 | |||
| 2025 | W | W | W | W | W | W | W | W | ||||
| 2026 | W | W | W | W | ||||||||
| - = No Data Reported; -- = Not Applicable; NA = Not Available; W = Withheld to avoid disclosure of individual company data. |
| Release Date: 6/30/2026 |
| Next Release Date: 7/31/2026 |