|
Download Data (XLS File) |
|
|||||
|
|||||
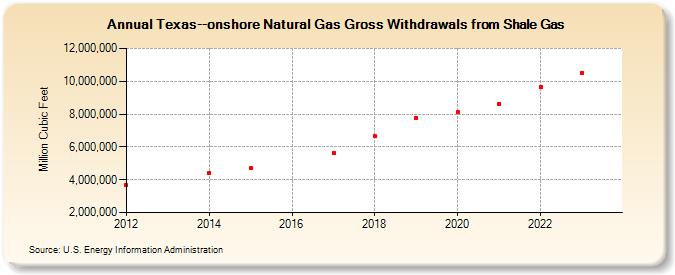
| Texas--onshore Natural Gas Gross Withdrawals from Shale Gas (Million Cubic Feet) | |||||
| Decade | Year-0 | Year-1 | Year-2 | Year-3 | Year-4 | Year-5 | Year-6 | Year-7 | Year-8 | Year-9 |
|---|---|---|---|---|---|---|---|---|---|---|
| 2010's | 3,662,933 | 4,408,980 | 4,683,831 | 5,632,295 | 6,638,851 | 7,762,285 | ||||
| 2020's | 8,134,830 | 8,634,037 | 9,676,793 | 10,525,752 | 11,163,159 |
| - = No Data Reported; -- = Not Applicable; NA = Not Available; W = Withheld to avoid disclosure of individual company data. |
| Release Date: 6/30/2026 |
| Next Release Date: 7/31/2026 |