|
Download Data (XLS File) |
|
||||||||
|
||||||||
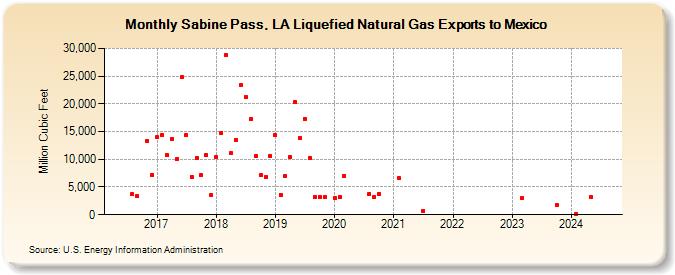
| Sabine Pass, LA Liquefied Natural Gas Exports to Mexico (Million Cubic Feet) | ||||||||
| Year | Jan | Feb | Mar | Apr | May | Jun | Jul | Aug | Sep | Oct | Nov | Dec |
|---|---|---|---|---|---|---|---|---|---|---|---|---|
| 2016 | 3,686 | 3,315 | 13,300 | 7,169 | ||||||||
| 2017 | 14,010 | 14,407 | 10,728 | 13,730 | 10,023 | 24,763 | 14,432 | 6,860 | 10,286 | 7,108 | 10,760 | 3,635 |
| 2018 | 10,431 | 14,777 | 28,877 | 11,074 | 13,512 | 23,351 | 21,237 | 17,244 | 10,559 | 7,076 | 6,794 | 10,610 |
| 2019 | 14,310 | 3,590 | 7,038 | 10,406 | 20,244 | 13,798 | 17,334 | 10,226 | 3,250 | 3,171 | 3,273 | |
| 2020 | 3,075 | 3,167 | 7,037 | 3,701 | 3,285 | 3,693 | ||||||
| 2021 | 6,608 | 758 | ||||||||||
| 2023 | 3,051 | 1,776 | ||||||||||
| 2024 | 87 | 3,190 | ||||||||||
| 2025 | 3,385 | |||||||||||
| - = No Data Reported; -- = Not Applicable; NA = Not Available; W = Withheld to avoid disclosure of individual company data. |
| Release Date: 6/30/2026 |
| Next Release Date: 7/31/2026 |