|
Download Data (XLS File) |
|
|||||
|
|||||
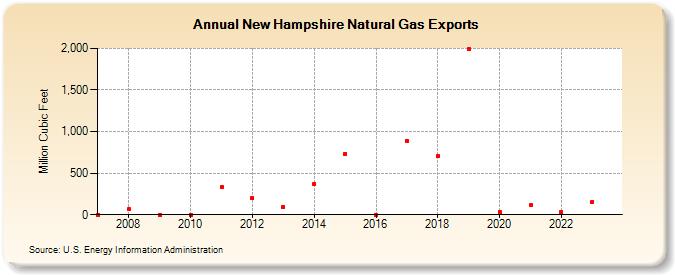
| New Hampshire Natural Gas Exports (Million Cubic Feet) | |||||
| Decade | Year-0 | Year-1 | Year-2 | Year-3 | Year-4 | Year-5 | Year-6 | Year-7 | Year-8 | Year-9 |
|---|---|---|---|---|---|---|---|---|---|---|
| 2000's | 0 | 64 | 0 | |||||||
| 2010's | 0 | 336 | 199 | 95 | 373 | 735 | 0 | 889 | 705 | 1,992 |
| 2020's | 34 | 113 | 33 | 153 | 63 |
| - = No Data Reported; -- = Not Applicable; NA = Not Available; W = Withheld to avoid disclosure of individual company data. |
| Release Date: 6/30/2026 |
| Next Release Date: 7/31/2026 |