|
Download Data (XLS File) |
|
|||||
|
|||||
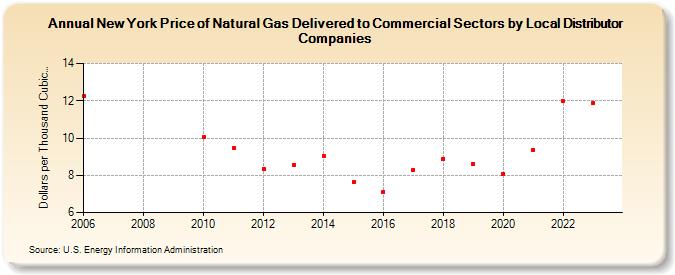
| New York Price of Natural Gas Delivered to Commercial Sectors by Local Distributor Companies (Dollars per Thousand Cubic Feet) | |||||
| Decade | Year-0 | Year-1 | Year-2 | Year-3 | Year-4 | Year-5 | Year-6 | Year-7 | Year-8 | Year-9 |
|---|---|---|---|---|---|---|---|---|---|---|
| 2000's | 12.28 | |||||||||
| 2010's | 10.06 | 9.48 | 8.35 | 8.57 | 9.02 | 7.65 | 7.13 | 8.31 | 8.90 | 8.63 |
| 2020's | 8.09 | 9.35 | 11.96 | 11.79 | 14.56 |
| - = No Data Reported; -- = Not Applicable; NA = Not Available; W = Withheld to avoid disclosure of individual company data. |
| Release Date: 6/30/2026 |
| Next Release Date: 7/31/2026 |