|
Download Data (XLS File) |
|
||||||||
|
||||||||
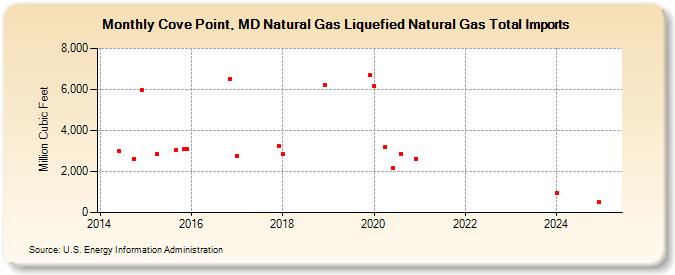
| Cove Point, MD Natural Gas Liquefied Natural Gas Total Imports (Million Cubic Feet) | ||||||||
| Year | Jan | Feb | Mar | Apr | May | Jun | Jul | Aug | Sep | Oct | Nov | Dec |
|---|---|---|---|---|---|---|---|---|---|---|---|---|
| 2014 | 2,984 | 2,621 | 5,981 | |||||||||
| 2015 | 2,844 | 3,045 | 3,097 | 3,105 | ||||||||
| 2016 | 6,505 | |||||||||||
| 2017 | 2,753 | 3,239 | ||||||||||
| 2018 | 2,853 | 6,217 | ||||||||||
| 2019 | 6,703 | |||||||||||
| 2020 | 6,186 | 3,214 | 2,178 | 2,874 | 2,629 | |||||||
| 2024 | 967 | 526 | ||||||||||
| 2025 | 1,156 | |||||||||||
| 2026 | 4,524 | |||||||||||
| - = No Data Reported; -- = Not Applicable; NA = Not Available; W = Withheld to avoid disclosure of individual company data. |
| Release Date: 4/30/2026 |
| Next Release Date: 5/29/2026 |