|
Download Data (XLS File) |
|
|||||
|
|||||
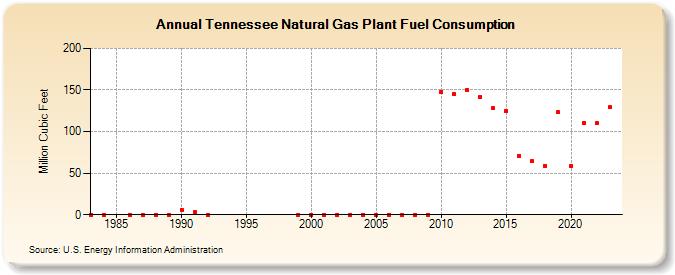
| Tennessee Natural Gas Plant Fuel Consumption (Million Cubic Feet) | |||||
| Decade | Year-0 | Year-1 | Year-2 | Year-3 | Year-4 | Year-5 | Year-6 | Year-7 | Year-8 | Year-9 |
|---|---|---|---|---|---|---|---|---|---|---|
| 1980's | 0 | 0 | 0 | 0 | 0 | 0 | ||||
| 1990's | 6 | 3 | 0 | 0 | ||||||
| 2000's | 0 | 0 | 0 | 0 | 0 | 0 | 0 | 0 | 0 | 0 |
| 2010's | 148 | 145 | 150 | 142 | 128 | 125 | 71 | 64 | 59 | 123 |
| 2020's | 59 | 110 | 110 | 129 | 158 |
| - = No Data Reported; -- = Not Applicable; NA = Not Available; W = Withheld to avoid disclosure of individual company data. |
| Release Date: 6/30/2026 |
| Next Release Date: 7/31/2026 |