|
Download Data (XLS File) |
|
|||||
|
|||||
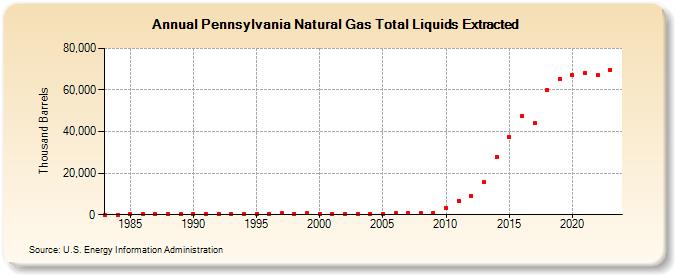
| Pennsylvania Natural Gas Total Liquids Extracted (Thousand Barrels) | |||||
| Decade | Year-0 | Year-1 | Year-2 | Year-3 | Year-4 | Year-5 | Year-6 | Year-7 | Year-8 | Year-9 |
|---|---|---|---|---|---|---|---|---|---|---|
| 1980's | 44 | 51 | 114 | 179 | 244 | 211 | 198 | |||
| 1990's | 232 | 338 | 436 | 402 | 394 | 446 | 458 | 587 | 554 | 674 |
| 2000's | 435 | 519 | 420 | 482 | 486 | 549 | 595 | 641 | 759 | 975 |
| 2010's | 3,421 | 6,721 | 8,882 | 15,496 | 27,903 | 37,523 | 47,335 | 43,942 | 60,180 | 65,363 |
| 2020's | 66,981 | 68,390 | 67,030 | 69,704 | 84,844 |
| - = No Data Reported; -- = Not Applicable; NA = Not Available; W = Withheld to avoid disclosure of individual company data. |
| Release Date: 6/30/2026 |
| Next Release Date: 7/31/2026 |