|
Download Data (XLS File) |
|
||||||||
|
||||||||
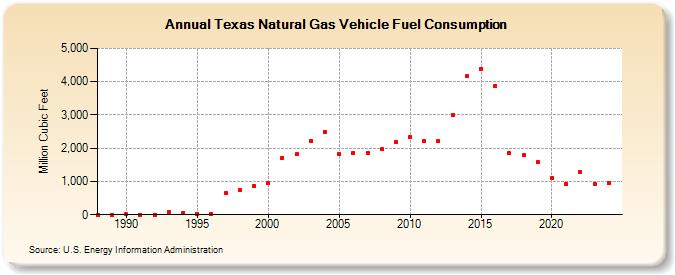
| Texas Natural Gas Vehicle Fuel Consumption (Million Cubic Feet) | ||||||||
| Decade | Year-0 | Year-1 | Year-2 | Year-3 | Year-4 | Year-5 | Year-6 | Year-7 | Year-8 | Year-9 |
|---|---|---|---|---|---|---|---|---|---|---|
| 1980's | 0 | 0 | ||||||||
| 1990's | 10 | 2 | 4 | 73 | 45 | 29 | 24 | 655 | 729 | 873 |
| 2000's | 960 | 1,715 | 1,811 | 2,213 | 2,485 | 1,811 | 1,866 | 1,868 | 1,966 | 2,181 |
| 2010's | 2,334 | 2,203 | 2,207 | 3,004 | 4,162 | 4,390 | 3,875 | 1,842 | 1,785 | 1,587 |
| 2020's | 1,114 | 938 | 1,272 | 925 | 2,712 | 2,266 |
| - = No Data Reported; -- = Not Applicable; NA = Not Available; W = Withheld to avoid disclosure of individual company data. |
| Release Date: 6/30/2026 |
| Next Release Date: 7/31/2026 |