|
Download Data (XLS File) |
|
||||||||
|
||||||||
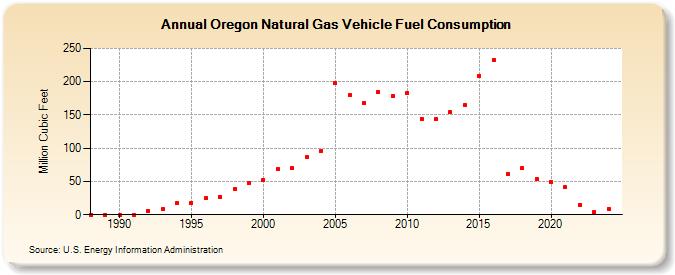
| Oregon Natural Gas Vehicle Fuel Consumption (Million Cubic Feet) | ||||||||
| Decade | Year-0 | Year-1 | Year-2 | Year-3 | Year-4 | Year-5 | Year-6 | Year-7 | Year-8 | Year-9 |
|---|---|---|---|---|---|---|---|---|---|---|
| 1980's | 0 | 0 | ||||||||
| 1990's | 0 | 0 | 6 | 8 | 17 | 18 | 25 | 27 | 39 | 47 |
| 2000's | 52 | 69 | 70 | 86 | 96 | 198 | 180 | 168 | 185 | 179 |
| 2010's | 183 | 144 | 144 | 154 | 165 | 209 | 233 | 61 | 70 | 54 |
| 2020's | 49 | 41 | 15 | 4 | 3 | 3 |
| - = No Data Reported; -- = Not Applicable; NA = Not Available; W = Withheld to avoid disclosure of individual company data. |
| Release Date: 6/30/2026 |
| Next Release Date: 7/31/2026 |