|
Download Data (XLS File) |
|
||||||||
|
||||||||
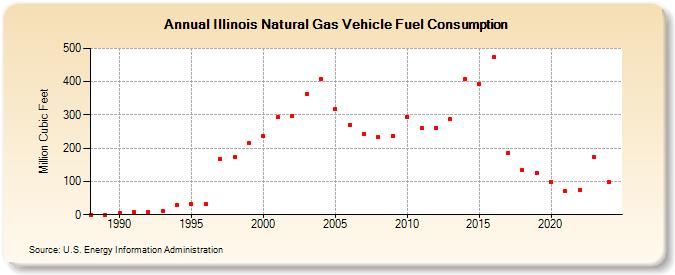
| Illinois Natural Gas Vehicle Fuel Consumption (Million Cubic Feet) | ||||||||
| Decade | Year-0 | Year-1 | Year-2 | Year-3 | Year-4 | Year-5 | Year-6 | Year-7 | Year-8 | Year-9 |
|---|---|---|---|---|---|---|---|---|---|---|
| 1980's | 0 | 0 | ||||||||
| 1990's | 5 | 7 | 8 | 12 | 29 | 31 | 32 | 167 | 173 | 215 |
| 2000's | 236 | 293 | 298 | 364 | 409 | 318 | 271 | 244 | 233 | 238 |
| 2010's | 294 | 261 | 262 | 287 | 407 | 393 | 473 | 186 | 135 | 126 |
| 2020's | 99 | 70 | 75 | 174 | 177 | 148 |
| - = No Data Reported; -- = Not Applicable; NA = Not Available; W = Withheld to avoid disclosure of individual company data. |
| Release Date: 6/30/2026 |
| Next Release Date: 7/31/2026 |