|
Download Data (XLS File) |
|
||||||||
|
||||||||
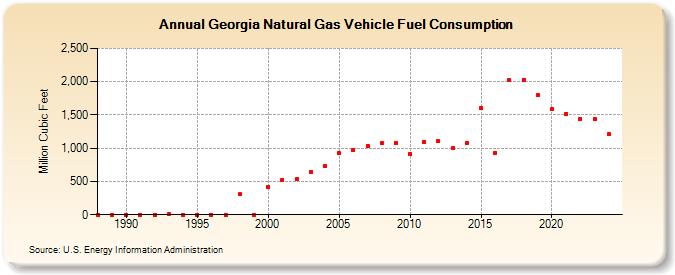
| Georgia Natural Gas Vehicle Fuel Consumption (Million Cubic Feet) | ||||||||
| Decade | Year-0 | Year-1 | Year-2 | Year-3 | Year-4 | Year-5 | Year-6 | Year-7 | Year-8 | Year-9 |
|---|---|---|---|---|---|---|---|---|---|---|
| 1980's | 0 | 0 | ||||||||
| 1990's | 0 | 0 | 0 | 4 | 3 | 2 | 1 | 0 | 305 | 0 |
| 2000's | 417 | 519 | 530 | 648 | 727 | 921 | 974 | 1,034 | 1,074 | 1,072 |
| 2010's | 915 | 1,097 | 1,104 | 998 | 1,082 | 1,600 | 933 | 2,019 | 2,031 | 1,795 |
| 2020's | 1,588 | 1,518 | 1,444 | 1,438 | 1,421 | 1,187 |
| - = No Data Reported; -- = Not Applicable; NA = Not Available; W = Withheld to avoid disclosure of individual company data. |
| Release Date: 6/30/2026 |
| Next Release Date: 7/31/2026 |