|
Download Data (XLS File) |
|
|||||
|
|||||
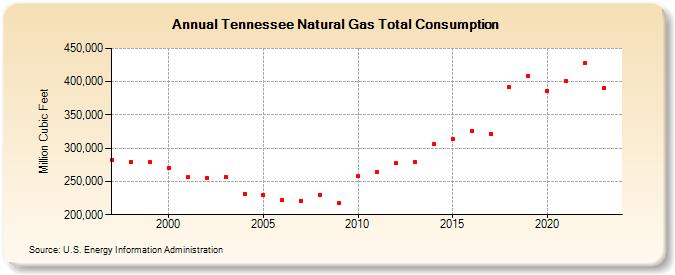
| Tennessee Natural Gas Total Consumption (Million Cubic Feet) | |||||
| Decade | Year-0 | Year-1 | Year-2 | Year-3 | Year-4 | Year-5 | Year-6 | Year-7 | Year-8 | Year-9 |
|---|---|---|---|---|---|---|---|---|---|---|
| 1990's | 282,395 | 279,070 | 278,841 | |||||||
| 2000's | 270,658 | 255,990 | 255,515 | 257,315 | 231,133 | 230,338 | 221,626 | 221,118 | 229,935 | 216,945 |
| 2010's | 257,443 | 264,231 | 277,127 | 279,441 | 305,633 | 313,379 | 326,546 | 321,644 | 392,161 | 408,045 |
| 2020's | 386,640 | 401,118 | 427,623 | 384,965 | 421,649 |
| - = No Data Reported; -- = Not Applicable; NA = Not Available; W = Withheld to avoid disclosure of individual company data. |
| Release Date: 6/30/2026 |
| Next Release Date: 7/31/2026 |