|
Download Data (XLS File) |
|
|||||
|
|||||
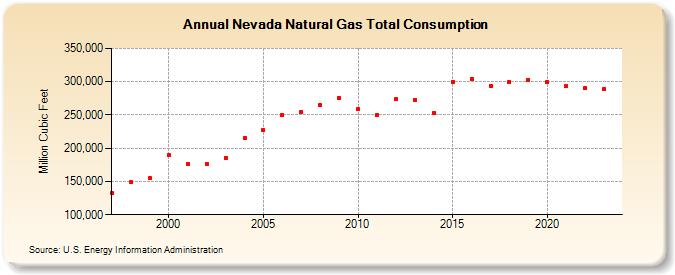
| Nevada Natural Gas Total Consumption (Million Cubic Feet) | |||||
| Decade | Year-0 | Year-1 | Year-2 | Year-3 | Year-4 | Year-5 | Year-6 | Year-7 | Year-8 | Year-9 |
|---|---|---|---|---|---|---|---|---|---|---|
| 1990's | 132,128 | 148,539 | 154,689 | |||||||
| 2000's | 189,170 | 176,835 | 176,596 | 185,846 | 214,984 | 227,149 | 249,608 | 254,406 | 264,596 | 275,468 |
| 2010's | 259,251 | 249,971 | 273,502 | 272,965 | 253,290 | 300,002 | 304,181 | 293,849 | 299,783 | 302,555 |
| 2020's | 299,340 | 293,756 | 290,129 | 288,666 | 283,186 |
| - = No Data Reported; -- = Not Applicable; NA = Not Available; W = Withheld to avoid disclosure of individual company data. |
| Release Date: 6/30/2026 |
| Next Release Date: 7/31/2026 |