|
Download Data (XLS File) |
|
|||||
|
|||||
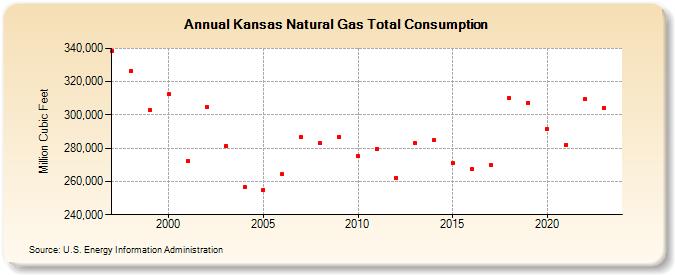
| Kansas Natural Gas Total Consumption (Million Cubic Feet) | |||||
| Decade | Year-0 | Year-1 | Year-2 | Year-3 | Year-4 | Year-5 | Year-6 | Year-7 | Year-8 | Year-9 |
|---|---|---|---|---|---|---|---|---|---|---|
| 1990's | 338,231 | 326,674 | 302,932 | |||||||
| 2000's | 312,369 | 272,500 | 304,992 | 281,346 | 256,779 | 255,123 | 264,253 | 286,538 | 282,904 | 286,973 |
| 2010's | 275,184 | 279,724 | 262,316 | 283,177 | 284,651 | 270,938 | 267,315 | 269,919 | 310,028 | 307,349 |
| 2020's | 291,418 | 282,202 | 309,308 | 301,209 | 303,502 |
| - = No Data Reported; -- = Not Applicable; NA = Not Available; W = Withheld to avoid disclosure of individual company data. |
| Release Date: 6/30/2026 |
| Next Release Date: 7/31/2026 |