|
Download Data (XLS File) |
|
|||||
|
|||||
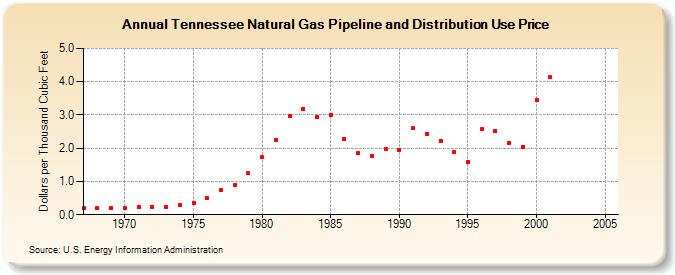
| Tennessee Natural Gas Pipeline and Distribution Use Price (Dollars per Thousand Cubic Feet) | |||||
| Decade | Year-0 | Year-1 | Year-2 | Year-3 | Year-4 | Year-5 | Year-6 | Year-7 | Year-8 | Year-9 |
|---|---|---|---|---|---|---|---|---|---|---|
| 1960's | 0.20 | 0.20 | 0.20 | |||||||
| 1970's | 0.20 | 0.22 | 0.23 | 0.24 | 0.28 | 0.36 | 0.49 | 0.73 | 0.89 | 1.26 |
| 1980's | 1.73 | 2.25 | 2.96 | 3.19 | 2.94 | 3.01 | 2.29 | 1.85 | 1.78 | 1.97 |
| 1990's | 1.94 | 2.61 | 2.44 | 2.23 | 1.88 | 1.59 | 2.57 | 2.52 | 2.17 | 2.04 |
| 2000's | 3.44 | 4.13 | NA | -- | -- | -- |
| - = No Data Reported; -- = Not Applicable; NA = Not Available; W = Withheld to avoid disclosure of individual company data. |
| Release Date: 6/30/2026 |
| Next Release Date: 7/31/2026 |