|
Download Data (XLS File) |
|
|||||
|
|||||
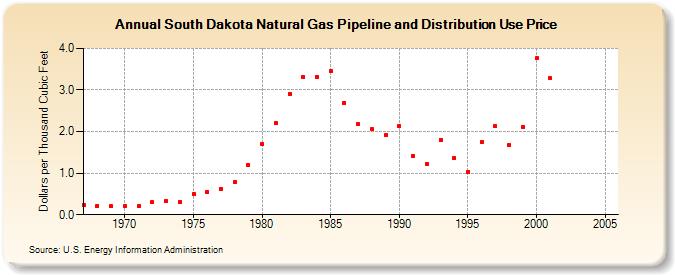
| South Dakota Natural Gas Pipeline and Distribution Use Price (Dollars per Thousand Cubic Feet) | |||||
| Decade | Year-0 | Year-1 | Year-2 | Year-3 | Year-4 | Year-5 | Year-6 | Year-7 | Year-8 | Year-9 |
|---|---|---|---|---|---|---|---|---|---|---|
| 1960's | 0.24 | 0.22 | 0.20 | |||||||
| 1970's | 0.20 | 0.20 | 0.30 | 0.33 | 0.31 | 0.50 | 0.55 | 0.63 | 0.78 | 1.20 |
| 1980's | 1.71 | 2.20 | 2.91 | 3.31 | 3.32 | 3.46 | 2.69 | 2.17 | 2.05 | 1.91 |
| 1990's | 2.13 | 1.42 | 1.22 | 1.80 | 1.36 | 1.03 | 1.75 | 2.13 | 1.68 | 2.12 |
| 2000's | 3.76 | 3.28 | NA | -- | -- | -- |
| - = No Data Reported; -- = Not Applicable; NA = Not Available; W = Withheld to avoid disclosure of individual company data. |
| Release Date: 3/31/2026 |
| Next Release Date: 4/30/2026 |