|
Download Data (XLS File) |
|
|||||
|
|||||
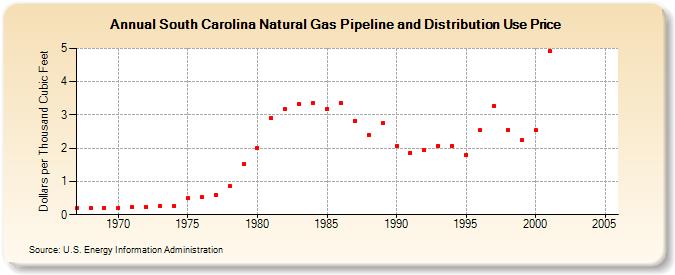
| South Carolina Natural Gas Pipeline and Distribution Use Price (Dollars per Thousand Cubic Feet) | |||||
| Decade | Year-0 | Year-1 | Year-2 | Year-3 | Year-4 | Year-5 | Year-6 | Year-7 | Year-8 | Year-9 |
|---|---|---|---|---|---|---|---|---|---|---|
| 1960's | 0.20 | 0.20 | 0.21 | |||||||
| 1970's | 0.21 | 0.22 | 0.24 | 0.26 | 0.27 | 0.49 | 0.52 | 0.59 | 0.85 | 1.52 |
| 1980's | 2.02 | 2.91 | 3.17 | 3.32 | 3.37 | 3.18 | 3.37 | 2.82 | 2.40 | 2.75 |
| 1990's | 2.06 | 1.87 | 1.94 | 2.08 | 2.06 | 1.80 | 2.54 | 3.28 | 2.55 | 2.24 |
| 2000's | 2.54 | 4.91 | NA | -- | -- | -- |
| - = No Data Reported; -- = Not Applicable; NA = Not Available; W = Withheld to avoid disclosure of individual company data. |
| Release Date: 6/30/2026 |
| Next Release Date: 7/31/2026 |