|
Download Data (XLS File) |
|
|||||
|
|||||
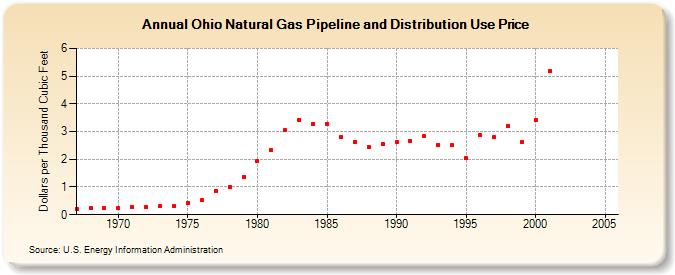
| Ohio Natural Gas Pipeline and Distribution Use Price (Dollars per Thousand Cubic Feet) | |||||
| Decade | Year-0 | Year-1 | Year-2 | Year-3 | Year-4 | Year-5 | Year-6 | Year-7 | Year-8 | Year-9 |
|---|---|---|---|---|---|---|---|---|---|---|
| 1960's | 0.22 | 0.23 | 0.23 | |||||||
| 1970's | 0.23 | 0.27 | 0.28 | 0.30 | 0.32 | 0.43 | 0.53 | 0.87 | 1.01 | 1.37 |
| 1980's | 1.92 | 2.33 | 3.04 | 3.42 | 3.28 | 3.28 | 2.79 | 2.64 | 2.43 | 2.54 |
| 1990's | 2.61 | 2.66 | 2.83 | 2.53 | 2.50 | 2.03 | 2.88 | 2.80 | 3.20 | 2.63 |
| 2000's | 3.41 | 5.18 | NA | -- | -- | -- |
| - = No Data Reported; -- = Not Applicable; NA = Not Available; W = Withheld to avoid disclosure of individual company data. |
| Release Date: 6/30/2026 |
| Next Release Date: 7/31/2026 |