|
Download Data (XLS File) |
|
|||||
|
|||||
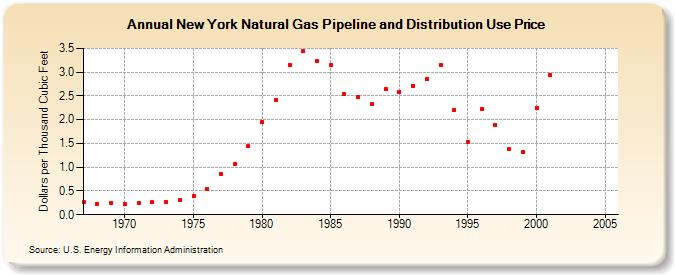
| New York Natural Gas Pipeline and Distribution Use Price (Dollars per Thousand Cubic Feet) | |||||
| Decade | Year-0 | Year-1 | Year-2 | Year-3 | Year-4 | Year-5 | Year-6 | Year-7 | Year-8 | Year-9 |
|---|---|---|---|---|---|---|---|---|---|---|
| 1960's | 0.26 | 0.23 | 0.25 | |||||||
| 1970's | 0.23 | 0.25 | 0.26 | 0.27 | 0.31 | 0.39 | 0.54 | 0.85 | 1.07 | 1.44 |
| 1980's | 1.95 | 2.41 | 3.15 | 3.44 | 3.23 | 3.15 | 2.53 | 2.47 | 2.33 | 2.64 |
| 1990's | 2.59 | 2.71 | 2.86 | 3.15 | 2.21 | 1.52 | 2.23 | 1.89 | 1.38 | 1.31 |
| 2000's | 2.25 | 2.94 | NA | -- | -- | -- |
| - = No Data Reported; -- = Not Applicable; NA = Not Available; W = Withheld to avoid disclosure of individual company data. |
| Release Date: 6/30/2026 |
| Next Release Date: 7/31/2026 |