|
Download Data (XLS File) |
|
|||||
|
|||||
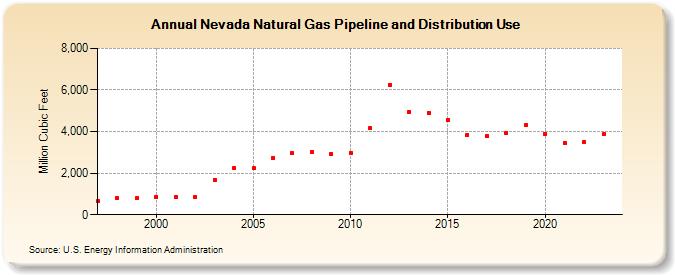
| Nevada Natural Gas Pipeline and Distribution Use (Million Cubic Feet) | |||||
| Decade | Year-0 | Year-1 | Year-2 | Year-3 | Year-4 | Year-5 | Year-6 | Year-7 | Year-8 | Year-9 |
|---|---|---|---|---|---|---|---|---|---|---|
| 1990's | 656 | 782 | 801 | |||||||
| 2000's | 876 | 863 | 851 | 1,689 | 2,256 | 2,224 | 2,737 | 2,976 | 3,013 | 2,921 |
| 2010's | 2,992 | 4,161 | 6,256 | 4,954 | 4,912 | 4,563 | 3,856 | 3,780 | 3,945 | 4,304 |
| 2020's | 3,899 | 3,467 | 3,503 | 3,874 | 2,791 |
| - = No Data Reported; -- = Not Applicable; NA = Not Available; W = Withheld to avoid disclosure of individual company data. |
| Release Date: 6/30/2026 |
| Next Release Date: 7/31/2026 |