|
Download Data (XLS File) |
|
|||||
|
|||||
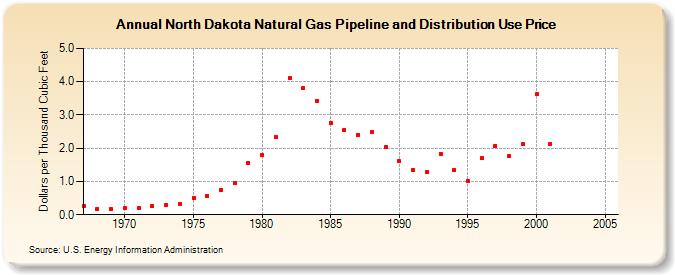
| North Dakota Natural Gas Pipeline and Distribution Use Price (Dollars per Thousand Cubic Feet) | |||||
| Decade | Year-0 | Year-1 | Year-2 | Year-3 | Year-4 | Year-5 | Year-6 | Year-7 | Year-8 | Year-9 |
|---|---|---|---|---|---|---|---|---|---|---|
| 1960's | 0.27 | 0.17 | 0.17 | |||||||
| 1970's | 0.20 | 0.20 | 0.25 | 0.29 | 0.31 | 0.51 | 0.57 | 0.75 | 0.95 | 1.55 |
| 1980's | 1.81 | 2.34 | 4.11 | 3.80 | 3.42 | 2.77 | 2.56 | 2.40 | 2.49 | 2.03 |
| 1990's | 1.61 | 1.35 | 1.28 | 1.84 | 1.34 | 1.01 | 1.70 | 2.07 | 1.77 | 2.12 |
| 2000's | 3.62 | 2.14 | NA | -- | -- | -- |
| - = No Data Reported; -- = Not Applicable; NA = Not Available; W = Withheld to avoid disclosure of individual company data. |
| Release Date: 6/30/2026 |
| Next Release Date: 7/31/2026 |