|
Download Data (XLS File) |
|
|||||
|
|||||
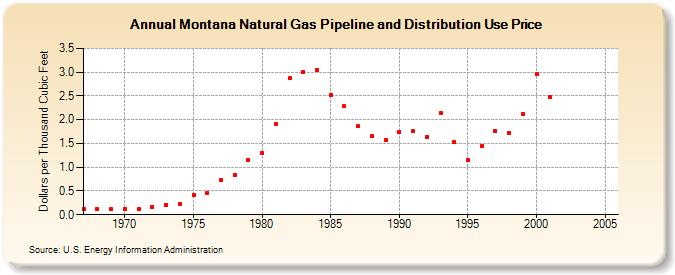
| Montana Natural Gas Pipeline and Distribution Use Price (Dollars per Thousand Cubic Feet) | |||||
| Decade | Year-0 | Year-1 | Year-2 | Year-3 | Year-4 | Year-5 | Year-6 | Year-7 | Year-8 | Year-9 |
|---|---|---|---|---|---|---|---|---|---|---|
| 1960's | 0.12 | 0.11 | 0.11 | |||||||
| 1970's | 0.11 | 0.12 | 0.17 | 0.21 | 0.23 | 0.42 | 0.46 | 0.73 | 0.83 | 1.16 |
| 1980's | 1.29 | 1.90 | 2.87 | 3.00 | 3.04 | 2.51 | 2.28 | 1.86 | 1.65 | 1.57 |
| 1990's | 1.75 | 1.76 | 1.63 | 2.15 | 1.53 | 1.16 | 1.44 | 1.77 | 1.72 | 2.12 |
| 2000's | 2.96 | 2.48 | NA | -- | -- | -- |
| - = No Data Reported; -- = Not Applicable; NA = Not Available; W = Withheld to avoid disclosure of individual company data. |
| Release Date: 6/30/2026 |
| Next Release Date: 7/31/2026 |