|
Download Data (XLS File) |
|
|||||
|
|||||
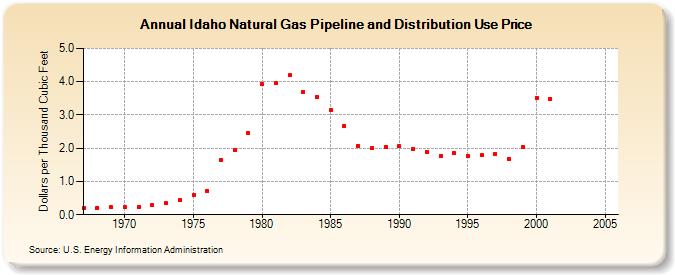
| Idaho Natural Gas Pipeline and Distribution Use Price (Dollars per Thousand Cubic Feet) | |||||
| Decade | Year-0 | Year-1 | Year-2 | Year-3 | Year-4 | Year-5 | Year-6 | Year-7 | Year-8 | Year-9 |
|---|---|---|---|---|---|---|---|---|---|---|
| 1960's | 0.21 | 0.21 | 0.22 | |||||||
| 1970's | 0.22 | 0.24 | 0.28 | 0.34 | 0.44 | 0.60 | 0.72 | 1.65 | 1.95 | 2.45 |
| 1980's | 3.93 | 3.95 | 4.19 | 3.69 | 3.55 | 3.15 | 2.67 | 2.08 | 2.00 | 2.05 |
| 1990's | 2.06 | 1.99 | 1.89 | 1.76 | 1.86 | 1.78 | 1.79 | 1.83 | 1.67 | 2.04 |
| 2000's | 3.52 | 3.49 | NA | -- | -- | -- |
| - = No Data Reported; -- = Not Applicable; NA = Not Available; W = Withheld to avoid disclosure of individual company data. |
| Release Date: 6/30/2026 |
| Next Release Date: 7/31/2026 |