|
Download Data (XLS File) |
|
|||||
|
|||||
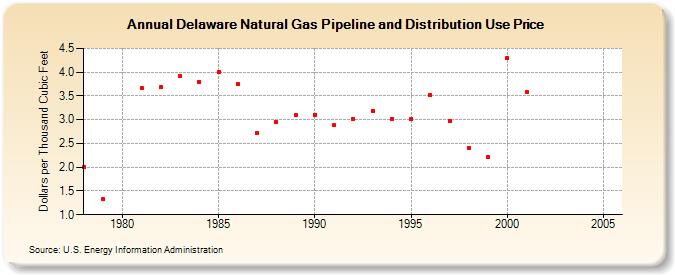
| Delaware Natural Gas Pipeline and Distribution Use Price (Dollars per Thousand Cubic Feet) | |||||
| Decade | Year-0 | Year-1 | Year-2 | Year-3 | Year-4 | Year-5 | Year-6 | Year-7 | Year-8 | Year-9 |
|---|---|---|---|---|---|---|---|---|---|---|
| 1970's | 2.00 | 1.33 | ||||||||
| 1980's | 3.67 | 3.68 | 3.91 | 3.80 | 4.00 | 3.75 | 2.71 | 2.95 | 3.10 | |
| 1990's | 3.10 | 2.88 | 3.01 | 3.19 | 3.02 | 3.02 | 3.51 | 2.98 | 2.40 | 2.22 |
| 2000's | 4.29 | 3.58 | NA | -- | -- | -- |
| - = No Data Reported; -- = Not Applicable; NA = Not Available; W = Withheld to avoid disclosure of individual company data. |
| Release Date: 6/30/2026 |
| Next Release Date: 7/31/2026 |