|
Download Data (XLS File) |
|
|||||
|
|||||
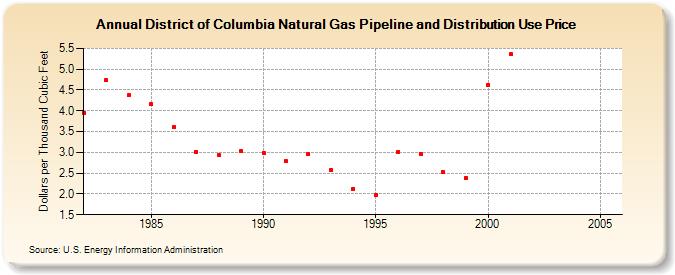
| District of Columbia Natural Gas Pipeline and Distribution Use Price (Dollars per Thousand Cubic Feet) | |||||
| Decade | Year-0 | Year-1 | Year-2 | Year-3 | Year-4 | Year-5 | Year-6 | Year-7 | Year-8 | Year-9 |
|---|---|---|---|---|---|---|---|---|---|---|
| 1980's | 3.94 | 4.73 | 4.37 | 4.16 | 3.61 | 3.02 | 2.94 | 3.03 | ||
| 1990's | 2.99 | 2.78 | 2.95 | 2.58 | 2.13 | 1.97 | 3.02 | 2.97 | 2.52 | 2.39 |
| 2000's | 4.63 | 5.36 | NA | -- | -- | -- |
| - = No Data Reported; -- = Not Applicable; NA = Not Available; W = Withheld to avoid disclosure of individual company data. |
| Release Date: 6/30/2026 |
| Next Release Date: 7/31/2026 |