|
Download Data (XLS File) |
|
||||||||
|
||||||||
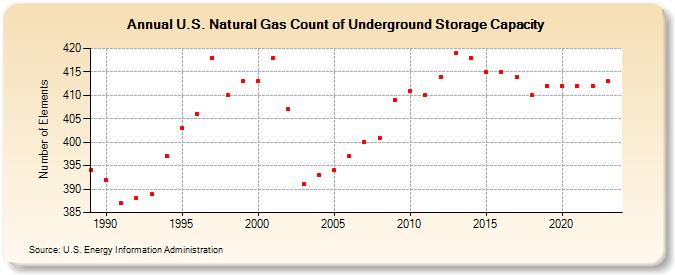
| U.S. Natural Gas Count of Underground Storage Capacity (Number of Elements) | ||||||||
| Decade | Year-0 | Year-1 | Year-2 | Year-3 | Year-4 | Year-5 | Year-6 | Year-7 | Year-8 | Year-9 |
|---|---|---|---|---|---|---|---|---|---|---|
| 1980's | 394 | |||||||||
| 1990's | 392 | 387 | 388 | 389 | 397 | 403 | 406 | 418 | 410 | 413 |
| 2000's | 413 | 418 | 407 | 391 | 393 | 394 | 397 | 400 | 401 | 409 |
| 2010's | 411 | 410 | 414 | 419 | 418 | 415 | 415 | 414 | 410 | 412 |
| 2020's | 412 | 412 | 412 | 413 | 414 |
| - = No Data Reported; -- = Not Applicable; NA = Not Available; W = Withheld to avoid disclosure of individual company data. |
| Release Date: 6/30/2026 |
| Next Release Date: 7/31/2026 |