|
Download Data (XLS File) |
|
|||||
|
|||||
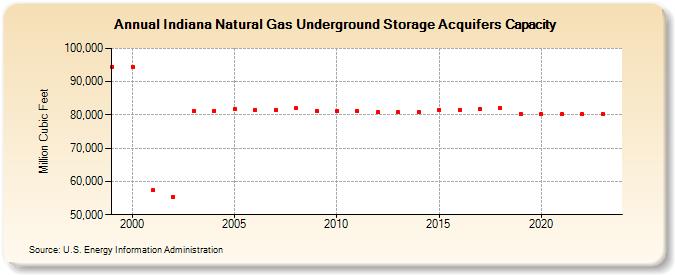
| Indiana Natural Gas Underground Storage Acquifers Capacity (Million Cubic Feet) | |||||
| Decade | Year-0 | Year-1 | Year-2 | Year-3 | Year-4 | Year-5 | Year-6 | Year-7 | Year-8 | Year-9 |
|---|---|---|---|---|---|---|---|---|---|---|
| 1990's | 94,536 | |||||||||
| 2000's | 94,536 | 57,300 | 55,410 | 81,317 | 81,317 | 81,641 | 81,490 | 81,490 | 81,991 | 81,328 |
| 2010's | 81,268 | 81,310 | 80,746 | 80,746 | 80,746 | 81,578 | 81,578 | 81,717 | 82,071 | 80,293 |
| 2020's | 80,230 | 80,230 | 80,230 | 80,243 | 80,243 |
| - = No Data Reported; -- = Not Applicable; NA = Not Available; W = Withheld to avoid disclosure of individual company data. |
| Release Date: 6/30/2026 |
| Next Release Date: 7/31/2026 |