|
Download Data (XLS File) |
|
|||||
|
|||||
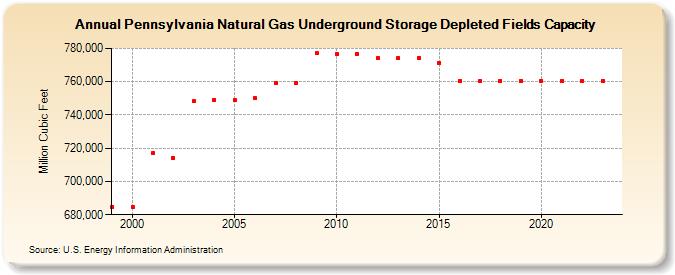
| Pennsylvania Natural Gas Underground Storage Depleted Fields Capacity (Million Cubic Feet) | |||||
| Decade | Year-0 | Year-1 | Year-2 | Year-3 | Year-4 | Year-5 | Year-6 | Year-7 | Year-8 | Year-9 |
|---|---|---|---|---|---|---|---|---|---|---|
| 1990's | 684,842 | |||||||||
| 2000's | 684,518 | 717,070 | 714,216 | 748,074 | 749,018 | 748,792 | 750,054 | 759,365 | 759,153 | 776,964 |
| 2010's | 776,822 | 776,845 | 774,309 | 774,309 | 774,309 | 771,422 | 760,619 | 760,619 | 760,619 | 760,619 |
| 2020's | 760,619 | 760,619 | 760,629 | 760,619 | 760,619 |
| - = No Data Reported; -- = Not Applicable; NA = Not Available; W = Withheld to avoid disclosure of individual company data. |
| Release Date: 6/30/2026 |
| Next Release Date: 7/31/2026 |