|
Download Data (XLS File) |
|
|||||
|
|||||
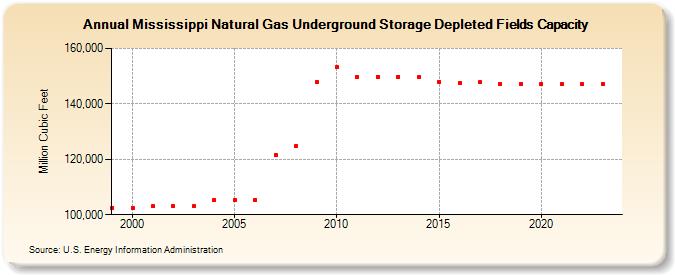
| Mississippi Natural Gas Underground Storage Depleted Fields Capacity (Million Cubic Feet) | |||||
| Decade | Year-0 | Year-1 | Year-2 | Year-3 | Year-4 | Year-5 | Year-6 | Year-7 | Year-8 | Year-9 |
|---|---|---|---|---|---|---|---|---|---|---|
| 1990's | 102,595 | |||||||||
| 2000's | 102,595 | 102,970 | 102,970 | 102,970 | 105,370 | 105,370 | 105,427 | 121,527 | 124,827 | 147,827 |
| 2010's | 153,227 | 149,789 | 149,789 | 149,789 | 149,659 | 147,969 | 147,662 | 147,800 | 147,100 | 147,100 |
| 2020's | 147,100 | 147,100 | 147,100 | 147,100 | 147,100 |
| - = No Data Reported; -- = Not Applicable; NA = Not Available; W = Withheld to avoid disclosure of individual company data. |
| Release Date: 6/30/2026 |
| Next Release Date: 7/31/2026 |