|
Download Data (XLS File) |
|
|||||
|
|||||
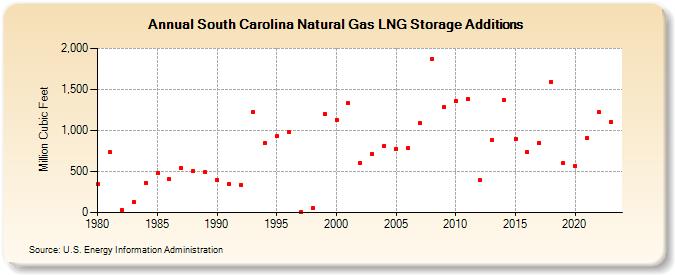
| South Carolina Natural Gas LNG Storage Additions (Million Cubic Feet) | |||||
| Decade | Year-0 | Year-1 | Year-2 | Year-3 | Year-4 | Year-5 | Year-6 | Year-7 | Year-8 | Year-9 |
|---|---|---|---|---|---|---|---|---|---|---|
| 1980's | 345 | 736 | 35 | 132 | 362 | 484 | 403 | 545 | 503 | 490 |
| 1990's | 394 | 346 | 339 | 1,231 | 847 | 927 | 976 | 6 | 56 | 1,204 |
| 2000's | 1,131 | 1,330 | 605 | 716 | 813 | 776 | 784 | 1,089 | 1,872 | 1,283 |
| 2010's | 1,360 | 1,386 | 391 | 879 | 1,371 | 902 | 736 | 850 | 1,595 | 605 |
| 2020's | 571 | 914 | 1,219 | 1,108 | 1,770 |
| - = No Data Reported; -- = Not Applicable; NA = Not Available; W = Withheld to avoid disclosure of individual company data. |
| Release Date: 6/30/2026 |
| Next Release Date: 7/31/2026 |