|
Download Data (XLS File) |
|
|||||
|
|||||
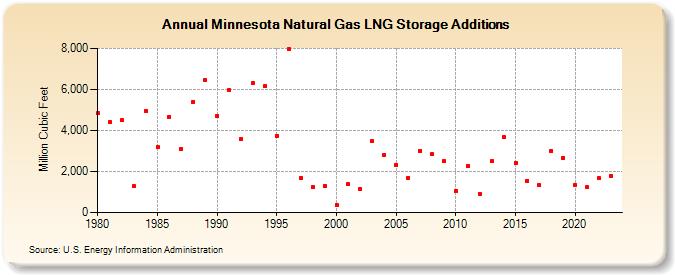
| Minnesota Natural Gas LNG Storage Additions (Million Cubic Feet) | |||||
| Decade | Year-0 | Year-1 | Year-2 | Year-3 | Year-4 | Year-5 | Year-6 | Year-7 | Year-8 | Year-9 |
|---|---|---|---|---|---|---|---|---|---|---|
| 1980's | 4,838 | 4,402 | 4,505 | 1,277 | 4,954 | 3,190 | 4,679 | 3,109 | 5,391 | 6,453 |
| 1990's | 4,714 | 5,974 | 3,594 | 6,330 | 6,167 | 3,746 | 7,990 | 1,686 | 1,233 | 1,295 |
| 2000's | 376 | 1,368 | 1,142 | 3,474 | 2,806 | 2,331 | 1,700 | 3,023 | 2,845 | 2,502 |
| 2010's | 1,059 | 2,257 | 918 | 2,515 | 3,686 | 2,414 | 1,560 | 1,329 | 3,001 | 2,665 |
| 2020's | 1,358 | 1,230 | 1,664 | 1,785 | 1,693 |
| - = No Data Reported; -- = Not Applicable; NA = Not Available; W = Withheld to avoid disclosure of individual company data. |
| Release Date: 6/30/2026 |
| Next Release Date: 7/31/2026 |