|
Download Data (XLS File) |
|
|||||
|
|||||
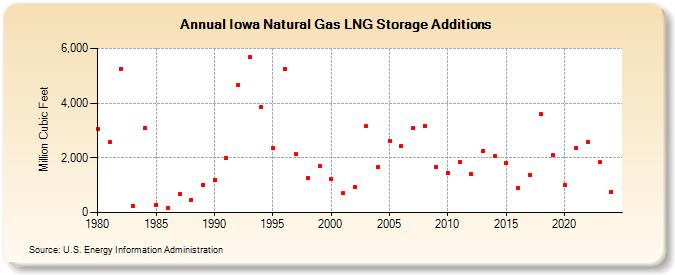
| Iowa Natural Gas LNG Storage Additions (Million Cubic Feet) | |||||
| Decade | Year-0 | Year-1 | Year-2 | Year-3 | Year-4 | Year-5 | Year-6 | Year-7 | Year-8 | Year-9 |
|---|---|---|---|---|---|---|---|---|---|---|
| 1980's | 3,063 | 2,576 | 5,243 | 256 | 3,089 | 289 | 154 | 670 | 477 | 1,008 |
| 1990's | 1,196 | 2,012 | 4,659 | 5,671 | 3,867 | 2,346 | 5,262 | 2,134 | 1,269 | 1,697 |
| 2000's | 1,226 | 702 | 943 | 3,153 | 1,665 | 2,626 | 2,438 | 3,080 | 3,178 | 1,652 |
| 2010's | 1,458 | 1,858 | 1,408 | 2,252 | 2,054 | 1,827 | 912 | 1,370 | 3,585 | 2,087 |
| 2020's | 1,000 | 2,375 | 2,581 | 1,836 | 762 |
| - = No Data Reported; -- = Not Applicable; NA = Not Available; W = Withheld to avoid disclosure of individual company data. |
| Release Date: 6/30/2026 |
| Next Release Date: 7/31/2026 |