|
Download Data (XLS File) |
|
|||||
|
|||||
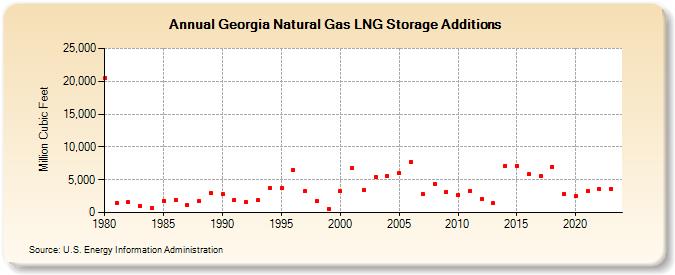
| Georgia Natural Gas LNG Storage Additions (Million Cubic Feet) | |||||
| Decade | Year-0 | Year-1 | Year-2 | Year-3 | Year-4 | Year-5 | Year-6 | Year-7 | Year-8 | Year-9 |
|---|---|---|---|---|---|---|---|---|---|---|
| 1980's | 20,484 | 1,508 | 1,555 | 1,024 | 678 | 1,834 | 1,942 | 1,150 | 1,702 | 2,930 |
| 1990's | 2,779 | 1,969 | 1,573 | 1,855 | 3,788 | 3,746 | 6,523 | 3,221 | 1,760 | 607 |
| 2000's | 3,241 | 6,772 | 3,426 | 5,422 | 5,570 | 5,971 | 7,705 | 2,817 | 4,372 | 3,182 |
| 2010's | 2,693 | 3,306 | 2,097 | 1,385 | 7,130 | 7,165 | 5,811 | 5,527 | 6,992 | 2,886 |
| 2020's | 2,451 | 3,253 | 3,581 | 3,633 | 4,676 |
| - = No Data Reported; -- = Not Applicable; NA = Not Available; W = Withheld to avoid disclosure of individual company data. |
| Release Date: 6/30/2026 |
| Next Release Date: 7/31/2026 |