|
Download Data (XLS File) |
|
||||||||
|
||||||||
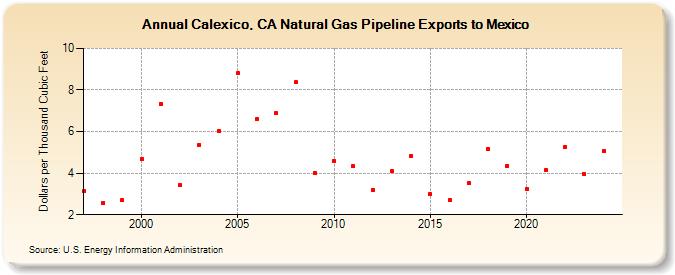
| Calexico, CA Natural Gas Pipeline Exports to Mexico (Dollars per Thousand Cubic Feet) | ||||||||
| Decade | Year-0 | Year-1 | Year-2 | Year-3 | Year-4 | Year-5 | Year-6 | Year-7 | Year-8 | Year-9 |
|---|---|---|---|---|---|---|---|---|---|---|
| 1990's | 3.15 | 2.58 | 2.69 | |||||||
| 2000's | 4.67 | 7.34 | 3.44 | 5.36 | 6.04 | 8.80 | 6.60 | 6.87 | 8.37 | 4.03 |
| 2010's | 4.60 | 4.33 | 3.20 | 4.10 | 4.82 | 2.99 | 2.71 | 3.51 | 5.16 | 4.36 |
| 2020's | 3.23 | 4.15 | 5.28 | 3.95 | 5.06 | 4.53 |
| - = No Data Reported; -- = Not Applicable; NA = Not Available; W = Withheld to avoid disclosure of individual company data. |
| Release Date: 6/30/2026 |
| Next Release Date: 7/31/2026 |