|
Download Data (XLS File) |
|
|||||
|
|||||
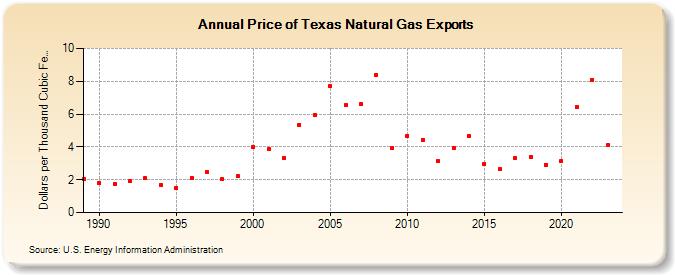
| Price of Texas Natural Gas Exports (Dollars per Thousand Cubic Feet) | |||||
| Decade | Year-0 | Year-1 | Year-2 | Year-3 | Year-4 | Year-5 | Year-6 | Year-7 | Year-8 | Year-9 |
|---|---|---|---|---|---|---|---|---|---|---|
| 1980's | 2.04 | |||||||||
| 1990's | 1.82 | 1.75 | 1.92 | 2.10 | 1.68 | 1.49 | 2.13 | 2.46 | 2.03 | 2.24 |
| 2000's | 4.00 | 3.86 | 3.32 | 5.36 | 5.93 | 7.69 | 6.54 | 6.61 | 8.39 | 3.91 |
| 2010's | 4.68 | 4.44 | 3.14 | 3.94 | 4.67 | 2.97 | 2.64 | 3.30 | 3.41 | 2.92 |
| 2020's | 3.14 | 6.46 | 8.08 | 4.21 | 3.59 |
| - = No Data Reported; -- = Not Applicable; NA = Not Available; W = Withheld to avoid disclosure of individual company data. |
| Release Date: 6/30/2026 |
| Next Release Date: 7/31/2026 |